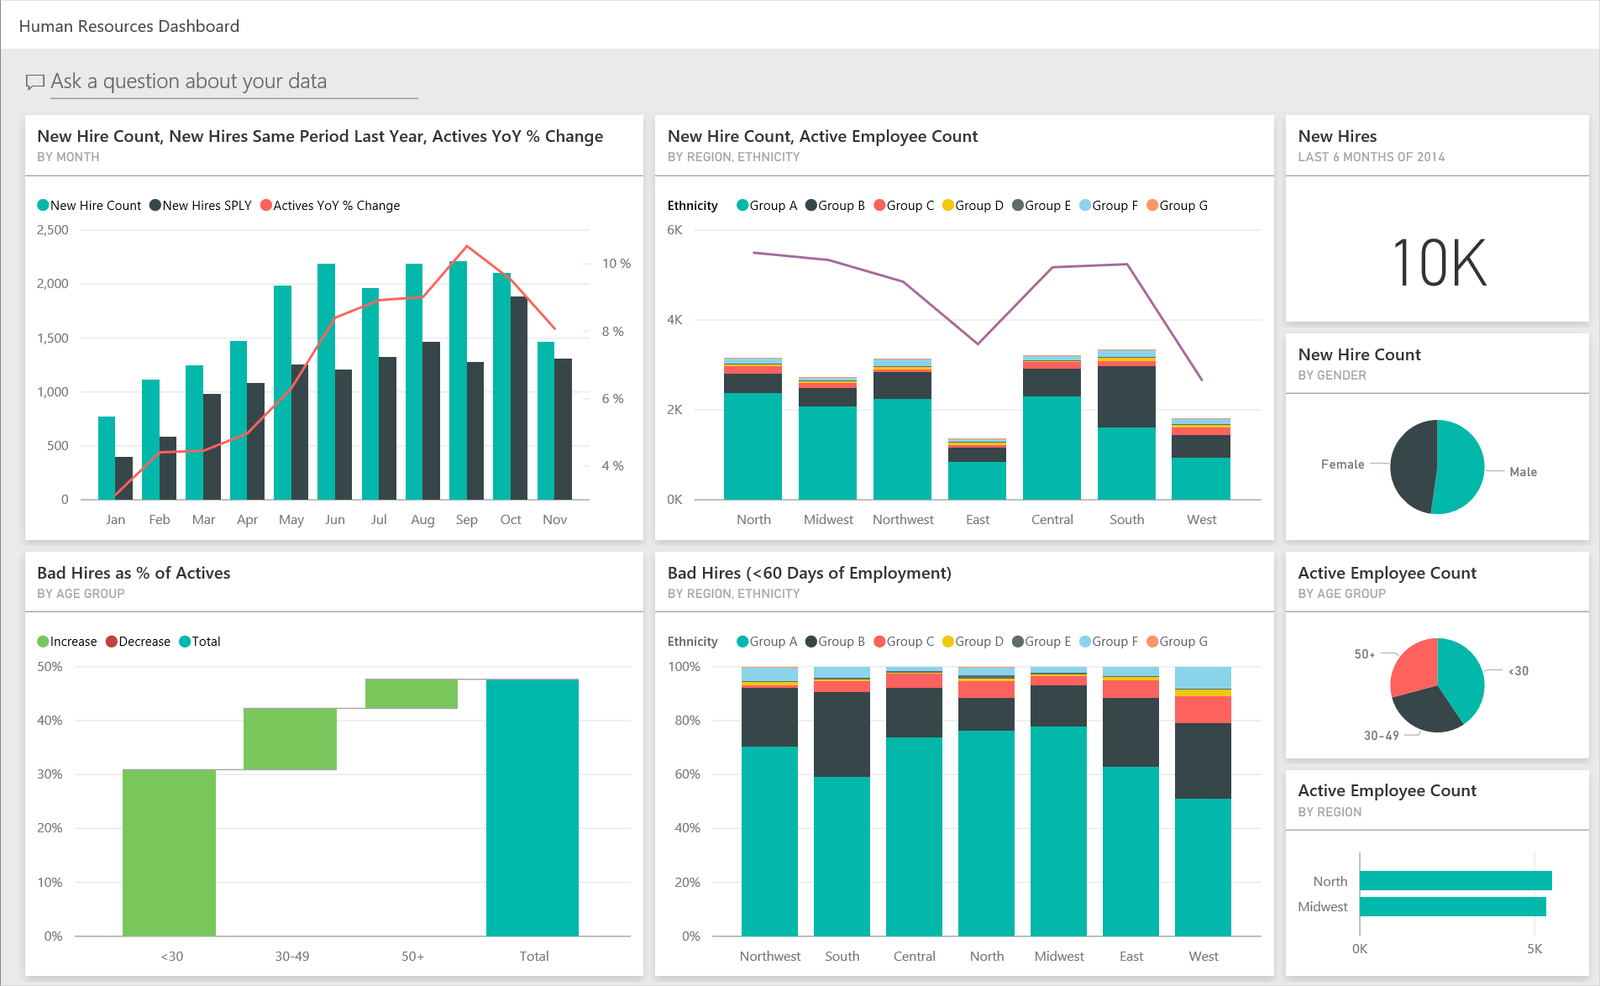
In today’s fast-paced business world, project management is crucial for achieving goals and delivering results. To help project managers track their performance, Key Performance Indicators (KPIs) play an essential role. A Project Management KPI Dashboard in Power BI is a powerful tool that visualizes these KPIs, enabling teams to make informed decisions quickly. In this article, we’ll walk you through a practical example of creating a Project Management KPI Dashboard using Power BI, illustrating a Power BI KPI dashboard example to enhance your understanding.
Understanding KPIs in Project Management
Before diving into Power BI, it’s essential to understand what KPIs are. KPIs are measurable values that demonstrate how effectively a project is achieving key objectives. Common project management KPIs include:
- Project Completion Rate: The percentage of completed tasks against the total tasks.
- Budget Variance: The difference between the budgeted and actual costs.
- Schedule Variance: The difference between the planned timeline and the actual completion date.
- Resource Utilization: How effectively team members are being utilized.
Setting Up Power BI
- Download and Install Power BI: If you haven’t already, download Power BI Desktop from the official Microsoft website. It’s free and user-friendly.
- Import Data: Start by importing your project data. You can use Excel, SQL Server, or other data sources. For this example, let’s assume you have an Excel sheet with the following columns:
- Task Name
- Assigned To
- Start Date
- End Date
- Status (Complete/In Progress/Not Started)
- Budgeted Cost
- Actual Cost
- Data Cleaning: Ensure your data is clean and formatted correctly. This step is crucial for accurate calculations and visualizations.
Creating the KPI Dashboard
- Open Power BI Desktop: Once your data is ready, open Power BI Desktop and load your data set.
- Add Visualizations:
- Project Completion Rate: Use a gauge chart to show the percentage of tasks completed.
- Budget Variance: Create a bar chart comparing budgeted vs. actual costs. This helps in visualizing how well the project is staying within budget.
- Schedule Variance: Use a line chart to display planned vs. actual completion dates over time.
- Resource Utilization: Create a pie chart to represent the workload distribution among team members.
- Design Your Dashboard:
- Arrange the visualizations in a logical order. For instance, place the Project Completion Rate at the top as it’s a key indicator.
- Use colors to differentiate between various statuses (e.g., red for overdue tasks, green for completed tasks).
- Ensure your dashboard is not cluttered. Each visualization should be clear and easy to read.
Interactivity and Filters
To make your dashboard more interactive, add filters:
- Date Range Filter: Allow users to select a date range to view project performance within specific periods.
- Task Status Filter: Let users filter tasks based on their status (Complete/In Progress/Not Started).
Publishing Your Dashboard
- Publish to Power BI Service: Once you’re satisfied with your dashboard, click on the “Publish” button in Power BI Desktop to share it with your team.
- Collaborate: In the Power BI service, you can collaborate with your team members. They can view the dashboard, add comments, and provide feedback.
Benefits of a KPI Dashboard in Power BI
- Real-Time Monitoring: A KPI dashboard allows project managers to monitor performance in real time, helping them make quick adjustments.
- Data-Driven Decisions: With visual representations of data, stakeholders can make informed decisions based on solid evidence.
- Increased Transparency: A shared dashboard promotes transparency among team members and stakeholders, ensuring everyone is aligned on project goals.
Conclusion
Creating a Project Management KPI Dashboard in Power BI is a practical way to track your project’s progress and performance. By using visual tools to display KPIs, project managers can ensure they are meeting their objectives while also promoting collaboration within their teams. This article serves as a practical power bi kpi dashboard example to guide you through the process. With Power BI’s user-friendly interface and powerful capabilities, building a dashboard tailored to your project management needs is easier than ever. Start today, and see how it can transform your project management processes!
